
1. What is a network?
A network is a set of interconnected nodes.[1] by their edges. In dynamic data structures there are also pointers that determine the direction in which the nodes interact. In our case, in the sourcing environment the buyer points to the supplier.
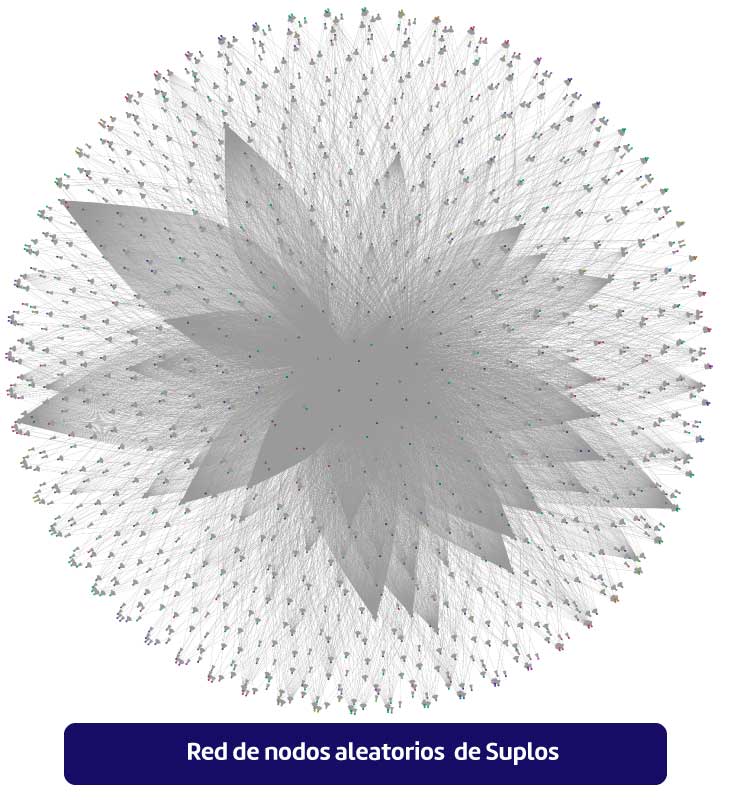
If we wanted to visualize both the suppliers and the buyers that are part of the Suplos networkIf we were to see something similar to the graph above, we would see something similar to the graph above. As the centralizer and facilitator of the network, Suplos is at the core, with strong links that, if we would like to understand better, we must explore in more detail characteristics of the network itself. (An image of the Suplos network organization can be seen at the end of this post.).
2. Alpha-Centrality
Also known as Katz centrality, it is a measure of the centrality of a node within a network. In the first measure, the closer a node is located (suppliers) The more important and more positive influence that node has on the interaction of internal sources, the more important and more positive influence it exerts on the interaction of internal sources, the more important and more positive influence it exerts on the interaction of internal sources. connecting neighbors (buyers).
Similarly, the more centrally located a node (supplier) of external sourcesthe stronger and more positive is its influence on the network (Suplos ecosystem).
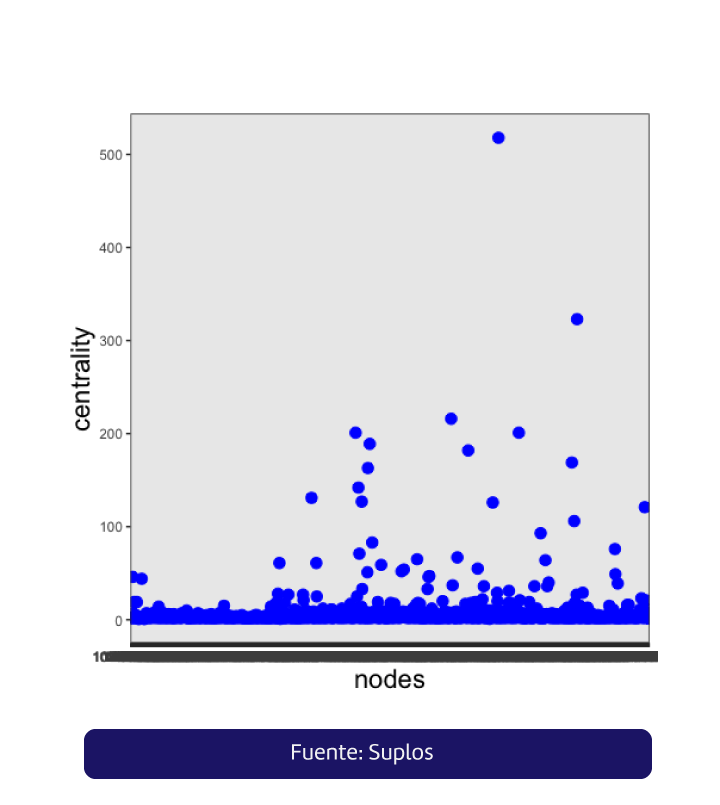
It is possible to calculate by means of power processes the amount of influence that some suppliers exert on some buyers. If we were to organize the information in descending order by alpha-centrality, we would see the following of the five most relevant nodes:
| Alpha-Centrality | |
|---|---|
| 1. Node 900.06... | 518 |
| 2. Node: 900.53.... | 323 |
| 3. Node: 860.53.... | 216 |
| 4. Node: 811.03.... | 201 |
| 5. Node: 900.16... | 201 |
3. Page-Rank
It is perhaps one of the most widely used algorithms in the world, was registered in 1999 and forms the basis of the recommendation engine used by Google to rank its searches.
PageRank numerically assigns the relevance of nodes indexed by a search engine. Each link that a node receives counts as a vote, but also computes the relevance of the node that casts the vote. The node quality and the number of links received determine the ranking of influence.
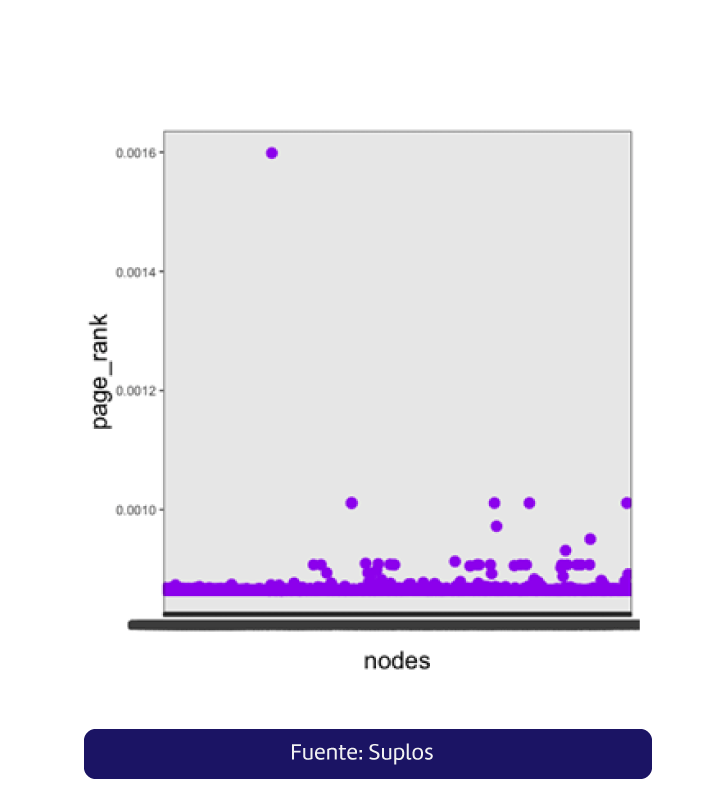
The previous graph shows that there are more than 50 nodes with influence capacity and they are considered by the algorithm as relevant for the network. These nodes are not only represented by buyers, that is to say that atome suppliers are key to network stabilization.
4. In-Degree
In Analytics the degree of a node in a network (sometimes incorrectly referred to as connectivity) is the number of connections or edges that a node has to other nodes. If a network is directed, meaning that the edges point in one direction from one node to another node, then the nodes have two different degrees, the entry level ("In-degree")which is the number of incoming edges, and the output level ("Out-degree")which is the number of protruding edges[2].
It is possible to calculate a probability function of degree of a network, defined as P(k)=nk/nwhere, nk is the number of nodes that have k degrees and n is the total number of nodes.
For our exercise, we focus on obtaining the numerical results of the input degrees, i.e., those nodes that receive Goods and/or Services awards.
| In-Degree | |
|---|---|
| 1. Node 900.06... | 517 |
| 2. Node: 900.53.... | 322 |
| 3. Node: 860.53.... | 215 |
| 4. Node: 811.03.... | 200 |
| 5. Node: 900.16... | 200 |
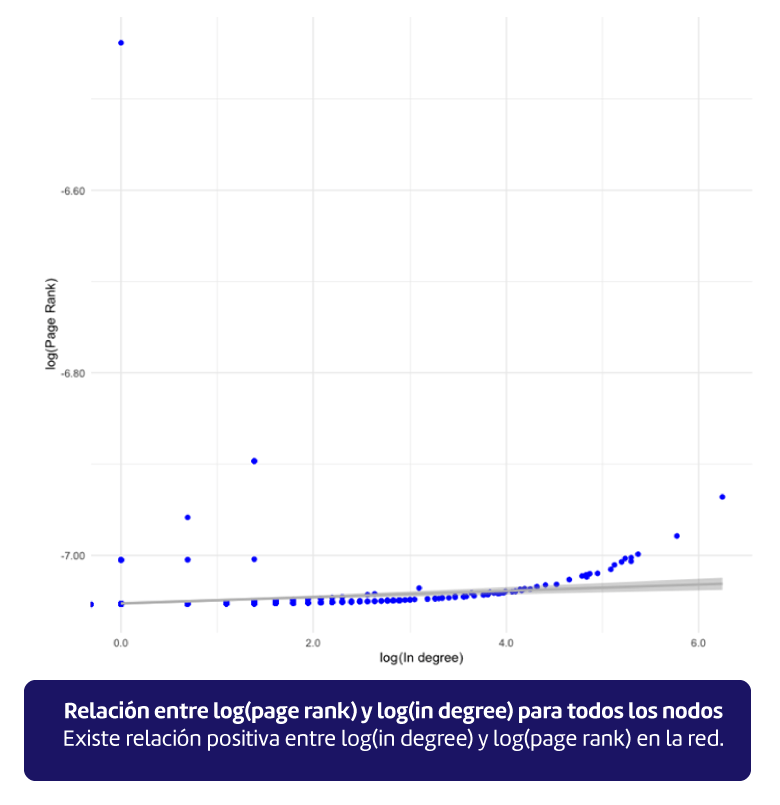
When comparing the two previous algorithms we found that they have a very positive correlation level[3], obtaining almost identical results for the 5 most influential nodes.
5. Suplos Network
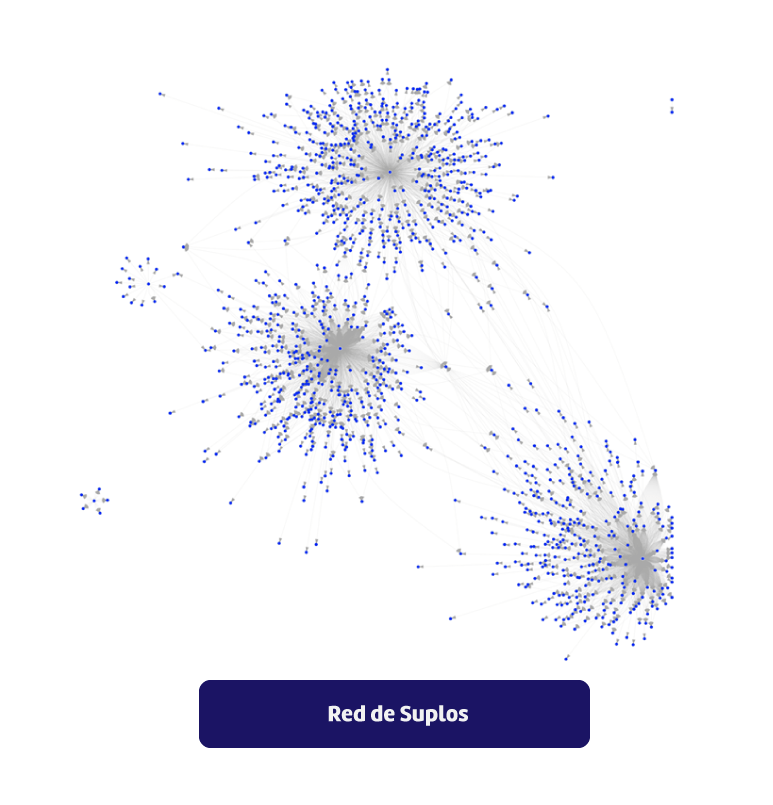
Take aways
- The Network shows the events awarded in Suplos, showing the cardinality of the pointers buyer -> supplier.
- There are more than 10 demand centralizing nodes, with special relevance of 3 nodes.
- In relation to the interaction between demand aggregators, their proximity is associated either by their geographic location or by belonging to the same economic sector.
- The closer a node (provider) is to its core, the stronger the link.and therefore its influence towards its buyer.
- There are centralizing nodes that appear as "islands", either because they are buyers with very recent interactions or because their geographic location or the specialization of their economic sector does not allow them to share suppliers within the network. However, As these nodes interact with more providers, they will move towards the center of the network.
- The results of the influence and relevance rankings (PageRank , In-Degree, Alpha-Centrality) of nodes offering goods or services are found closer to the center of the network and links close to their centralizing node.
[1] Wikipedia
[2] Wikipedia
[3] It is log-transformed to make a more obvious diagnosis of the relationship between the algorithms.


